Linear Regression is the simplest form of machine learning out there. In this tutorial, we will see how linear regression works and implement it in Python from scratch. This article is a written version of the video tutorial embedded below. If you prefer a video tutorial, you can jump to it directly, else you can continue to read the article.
Linear Regression
In statistics, linear regression is a linear approach to modelling the relationship between a dependent variable and one or more independent variables (To learn more about dependent and independent variables, read this article). In the case of one independent variable, it is called simple linear regression. For more than one independent variable, the process is called multiple linear regression. We will be dealing with simple linear regression in this tutorial.
Let X be the independent variable and Y be the dependent variable. We will define a linear relationship between these two variables as follows:
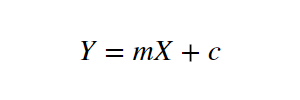
This is the equation for a line that you might have studied in high school. m is the slope of the line and c is the y-intercept. Today we will use this equation to train our model with a given dataset and predict the value of Y for any given value of X.
Now the challenge here is to determine the optimal values for m and c, that would give a minimum error for the given dataset. We will be doing this by using the Least Squares method.
Finding the Error
So to minimize the error we need a way to calculate the error in the first place. A loss function in machine learning is simply a measure of how different the predicted value is from the actual value.
In this tutorial, we will be using the Quadratic Loss Function to calculate the loss or error in our regression model. It is defined as mentioned below:
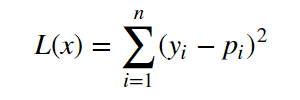
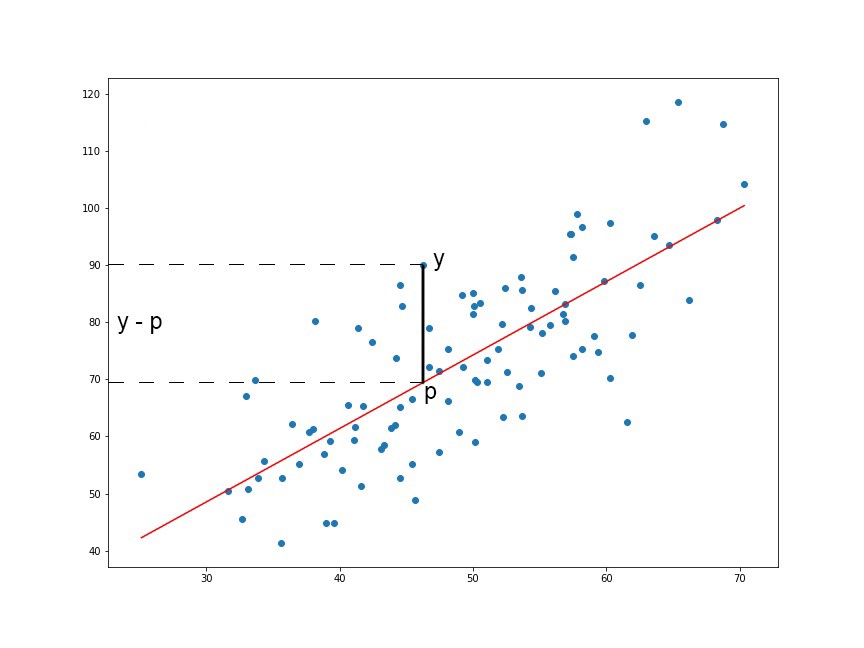
We are squaring it because, for the points below the regression line y — p (red line in the above graph), the difference of y and p will be negative whereas the difference will be positive for the values above the regression line… Summation of these differences (negative values and positives values) might nullify the error or not give a true picture of the total error of the model. Hence, we sum the square of the difference of actual value (y) and predicted value (p) while calculating the loss function.
Least Squares method
Now that we have determined the loss function, the only thing left to do is minimize it. This is done by finding the partial derivative of L, equating it to 0 and then finding an expression for m and c. After we do the math, we are left with these equations:
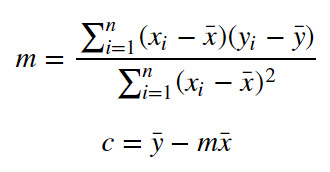
Here x̅ is the mean of all the values in the input X and ȳ is the mean of all the values in the desired output Y. This is the Least Squares method. Now we will implement this in python and make predictions.
Implementing the Model
1.287357370010931 9.908606190326509
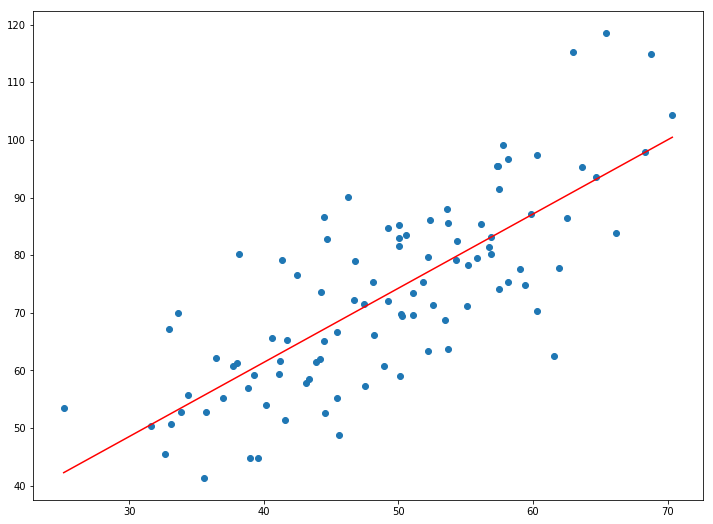
There won’t be much accuracy because we are simply taking a straight line and forcing it to fit into the given data in the best possible way. But you can use this to make simple predictions or get an idea about the magnitude/range of the real value. Also, this is a good first step for beginners in Machine Learning.
Find the dataset and the code used in the tutorial here: https://github.com/chasinginfinity/ml-from-scratch/tree/master/01%20Linear%20Regression%20using%20Least%20Squares
Got questions ? Need help ? Contact me!
Email: [email protected]
LinkedIn: https://www.linkedin.com/in/adarsh-menon-739573146/
Twitter: https://twitter.com/adarsh_menon_
Instagram: https://www.instagram.com/adarsh_menon_/
This article was originally published on towardsdatascience.com and kindly contributed to AI Planet (formerly DPhi) to spread the knowledge.
Become a guide. Become a mentor.
We at AI Planet (formerly DPhi), welcome you to share your experience in data science – be it your learning journey, experience while participating in Data Science Challenges, data science projects, tutorials and anything that is related to Data Science. Your learnings could help a large number of aspiring data scientists! Interested? Submit here.
2 Replies to “Tutorial on Linear Regression Using Least Squares”