Data Analysis Expressions (DAX) is a programming language that is used throughout Microsoft Power BI for creating calculated columns, measures, and custom tables. It is a collection of functions, operators, and constants that can be used in a formula, or expression, to calculate and return one or more values.
You can use DAX to solve several calculations and data analysis problems, which can help you create new information from data that is already in your model.
Syntax
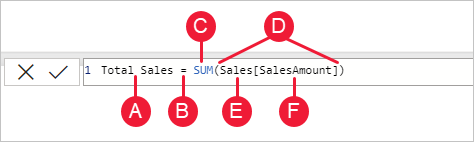
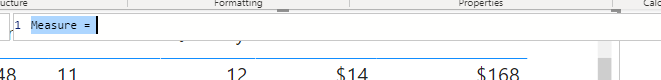
- A. The measure name, Total Sales.
- B. The equals sign operator (=), which indicates the beginning of the formula. When calculated, it will return a result.
- C. The DAX function SUM, which adds up all of the numbers in the Sales[SalesAmount] column.
- D. Parenthesis (), which surround an expression that contains one or more arguments. Most functions require at least one argument. An argument passes a value to a function.
- E. The referenced table, Sales.
- F. The referenced column, [SalesAmount], in the Sales table. With this argument, the SUM function knows which column to operate on.
Note
If a table name contains spaces, reserved keywords, or disallowed characters, you must enclose the table name in single quotation marks. You’ll also need to enclose table names in quotation marks if the name contains any characters outside the ANSI alphanumeric character range, regardless of whether your locale supports the character set or not.
Functions
Functions are predefined formulas that perform calculations by using specific values, called arguments, in a particular order or structure. Arguments can be other functions, another formula, expressions, column references, numbers, text, or logical values.
DAX functions are unique in the following ways:
- A DAX function always references a complete column or a table.
- DAX provides functions that let you use the current row value or a related value as a kind of argument.
- DAX includes many functions that return a table rather than a value. The table isn't displayed, but is used to provide input to other functions.
Use calculated columns
DAX allows you to augment the data that you bring in from different data sources by creating a calculated column that didn't originally exist in the data source. This feature should be used sparingly, which will be explained later in this module.
For example, assume that you are importing data from a database that contains sales transactions. Each individual sales transaction has the following columns: Order ID, Product ID, Quantity, and Unit Price. Notice that a column doesn't exist for the total sales amount for each order.
The following figure shows how the initial shape of the data appears in a Power BI table visual.
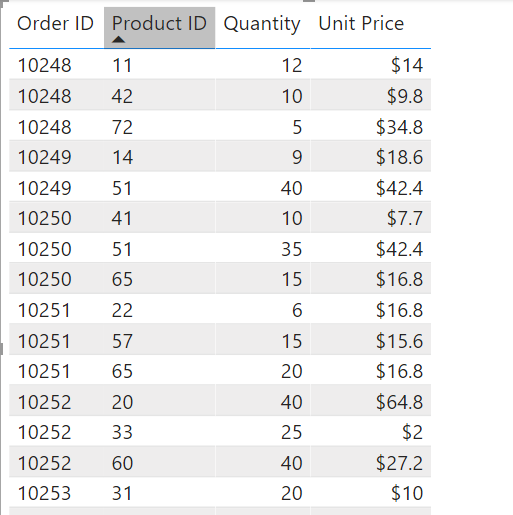
You can start using DAX by creating a calculated column that multiplies the unit price with the quantity. The calculated column will create a value for each row called Total Price. Create the new column by selecting the ellipsis (...) button on the table in the Fields list and then selecting New column.
Use measures
Calculated columns are useful when you need to operate row by row. However, other situations might require a simpler method. For example, consider a situation wherein you want an aggregation that operates over the entire dataset, and you want the total sales of all rows. Furthermore, you want to slice and dice that data by other criteria like total sales by year, by employee, or by product.
To accomplish those tasks, you would use a measure. You can build a measure without writing DAX code; Power BI will write it for you when you create a quick measure.
Like creating a calculated column, you can go to the Fields list, click the three-dot ellipsis on the selected field, and select New measure.