Creating a great data model is one of the most important tasks a data analyst can perform in Microsoft Power BI. By doing this job well, you help make it easier for people to understand your data, which will make building valuable Power BI reports easier for them and you.
Data modeling is one of the foundations of your Power BI reports, so it's important to set it up correctly. Creating a well-developed data model to help you fully communicate your organization's information is crucial.
Data modeling helps you optimize your tables and columns. Doing it right will save you so much time.
A good data model offers the following benefits:
- Faster data exploration
- Simpler aggregation building
- More accurate reporting
- Quicker report writing
- Easier report maintenance
Providing set rules for what makes a good data model is difficult because all data is different, and the usage of that data varies. Generally, a smaller data model is better because it will perform faster and be simpler to use. However, defining what a smaller data model entails is equally problematic because it's a heuristic and subjective concept.
Why is data modeling important ?
By modeling your data, you'll document what data you have, how you use it, and your requirements for usage, protection, and governance. Through data modeling, your organization:
- Creates a structure for collaboration between your IT team and your business teams.
- Exposes opportunities for improving business processes by defining data needs and uses.
- Saves time and money on IT and processes investments through appropriate planning upfront.
- Reduces errors (and error-prone redundant data entry) while improving data integrity.
- Increases the speed and performance of data retrieval and analytics by planning for capacity and growth.
- Sets and tracks target key performance indicators tailored to your business objectives.
So, it isn't just what you get with data modeling but also how you get it. The process itself provides significant benefits.
When talking about data modeling in general, the term you will hear most often is the star schema. This is a widely adopted approach to designing data warehouses and relational databases and is the recommended approach to take in Power BI as well.
There are two main benefits of using a star schema:
- Usability: A star schema makes your data model cleaner and more organized, and your report will be easier to use.
- Performance: Star schemas allow you to easily scale your report to very large volumes of data. DAX measures also calculate faster, and the Power BI report refreshes faster overall.
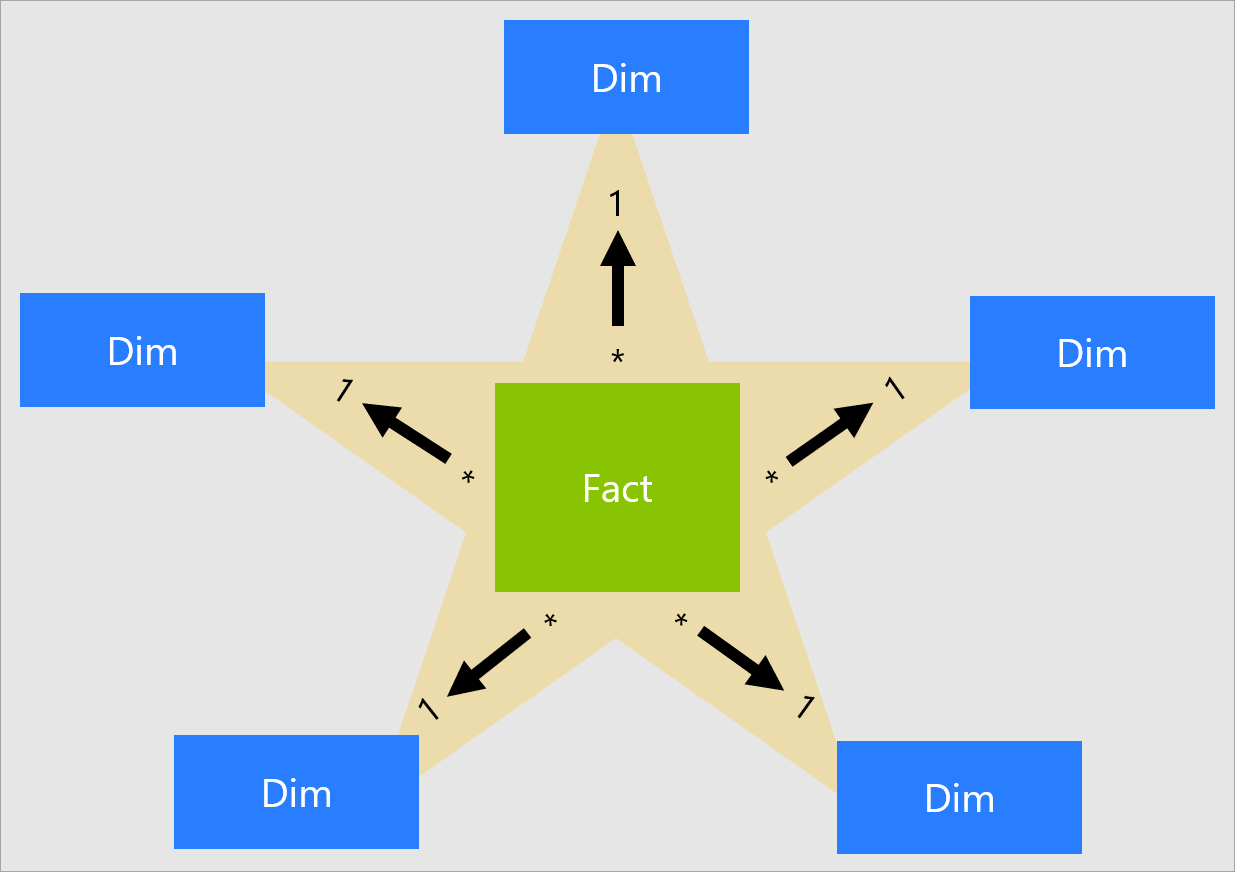
You can design a star schema to simplify your data. It's not the only way to simplify your data, but it's a popular method; therefore, every Power BI data analyst should understand it. In a star schema, each table within your dataset is defined as a dimension or a fact table.
A fact table is made up of values that can be summarized and aggregated, as well as one or more keys that link to the dimension tables.
Fact tables should be very narrow and include as few columns as possible - any columns that describe the features of a dataset should be included.
Fact tables contain information about events like sales orders, shipping dates, resellers, and suppliers.
Dimension tables describe the features of the dataset, where features are logically grouped together in separate tables to avoid bloating a single table or making it difficult to create relationships. When building a star schema, you'll have dimension and fact tables.
Dimension tables store details about business entities, such as products or time, and connect back to fact tables through a relationship.
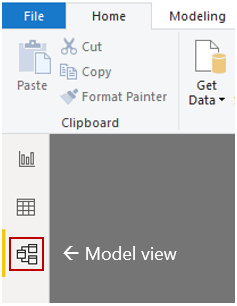
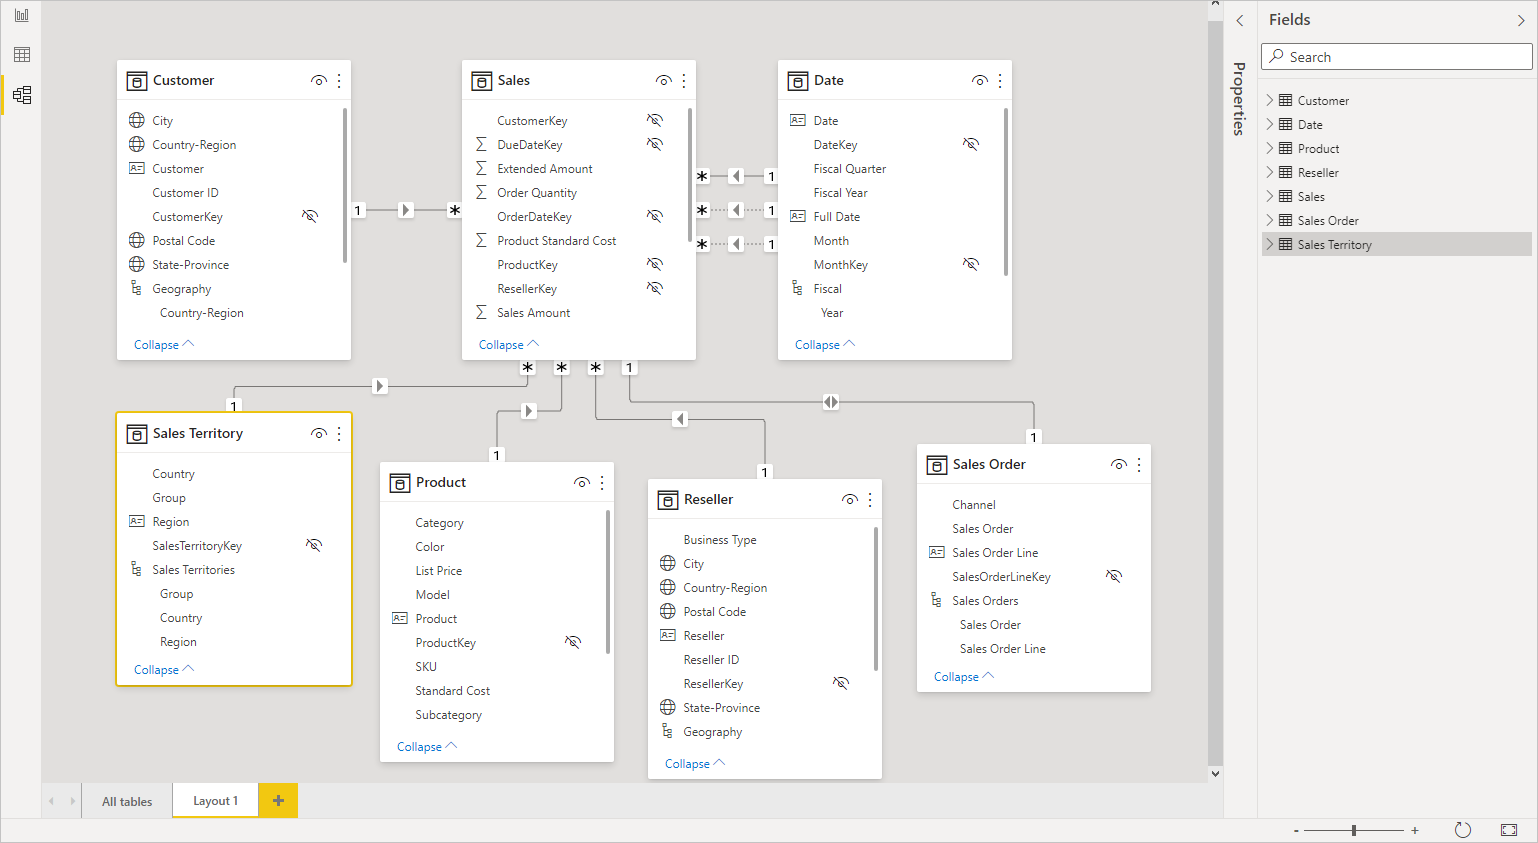
Relationships in Power BI
Relationships can be inactive or active. Only one active relationship can exist between tables. Furthermore, you can't create a direct active relationship between tables when an active set of indirect relationships already exists between these tables.
By default, Power BI will try to infer a relationship between tables; it doesn't always get this right, so you may wish to turn this feature off in the settings or delete any relationships that are created automatically.
Each model relationship is defined by a cardinality type. There are four cardinality type options, representing the data characteristics of the "from" and "to" related columns. The "one" side means the column contains unique values; the "many" side means the column can contain duplicate values.
- One-to-many (1:*)
- Many-to-one (*:1)
- One-to-one (1:1)
- Many-to-many (:)
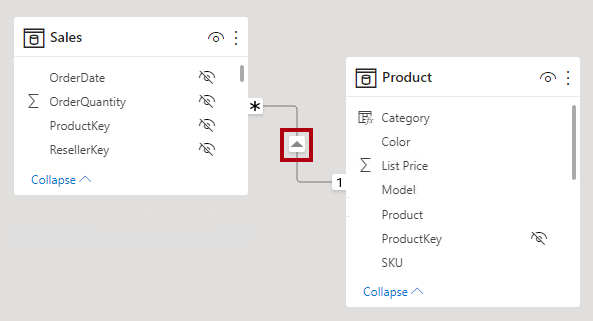
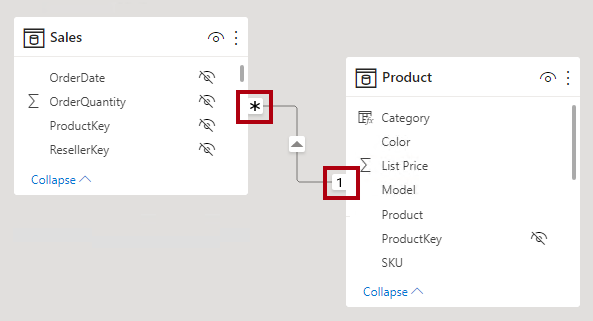
NOTE: In the Power BI Desktop model view, you can interpret a relationship's cardinality type by looking at the indicators (1 or *) on either side of the relationship line.
A single arrowhead represents a single-direction filter in the direction of the arrowhead; a double arrowhead represents a bi-directional relationship.