
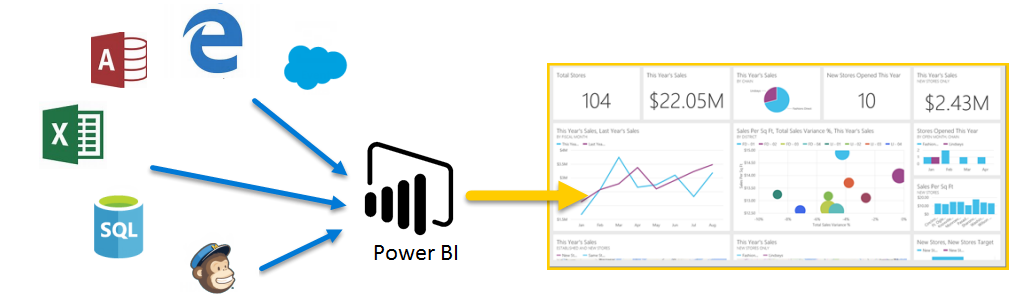
Microsoft Power BI is a collection of software services, apps, and connectors that turn unrelated data sources into interactive insights.
Whether your data is in a workbook or in a collection of cloud-based and on-premises data warehouses, Power BI lets data analysts connect to their data sources, visualize (or discover) what's important, and share their findings.
Power BI consists of a Microsoft Windows desktop application called Power BI Desktop, an online SaaS (Software as a Service) called the Power BI service, and mobile Power BI apps that are available on any device, with native mobile BI apps for Windows, iOS, and Android.
Everything you do in Microsoft Power BI has a few basic building blocks.
Here are the basic building blocks in Power BI:
- Visualizations
- Datasets
- Reports
- Dashboards
- Visualization
(sometimes also referred to as a visual) is a visual representation of data that you can create to represent your data. - Dataset
A dataset is a collection of data that Power BI uses to create its visualizations.
Datasets are associated with workspaces and a single dataset can be part of many workspaces. When you open a workspace, the associated datasets are listed under the Datasets tab. There are many different data sources supported. - Reports
A Power BI report is one or more pages of visualizations such as line charts, maps, and tree maps. Visualizations are also called visuals.
Reports let you create many visualizations, on multiple pages if necessary, and they let you arrange those visualizations in whatever way best tells your story. - Dashboards
A dashboard is something you create in the Power BI service or something a colleague creates in the Power BI service and shares with you.
A dashboard must fit on a single page, often called a canvas.