Learning Objectives
- Dependent and Independent Variables
- Equation of a Straight Line
- Linear Regression
- Cost
Dependent and Independent Variables
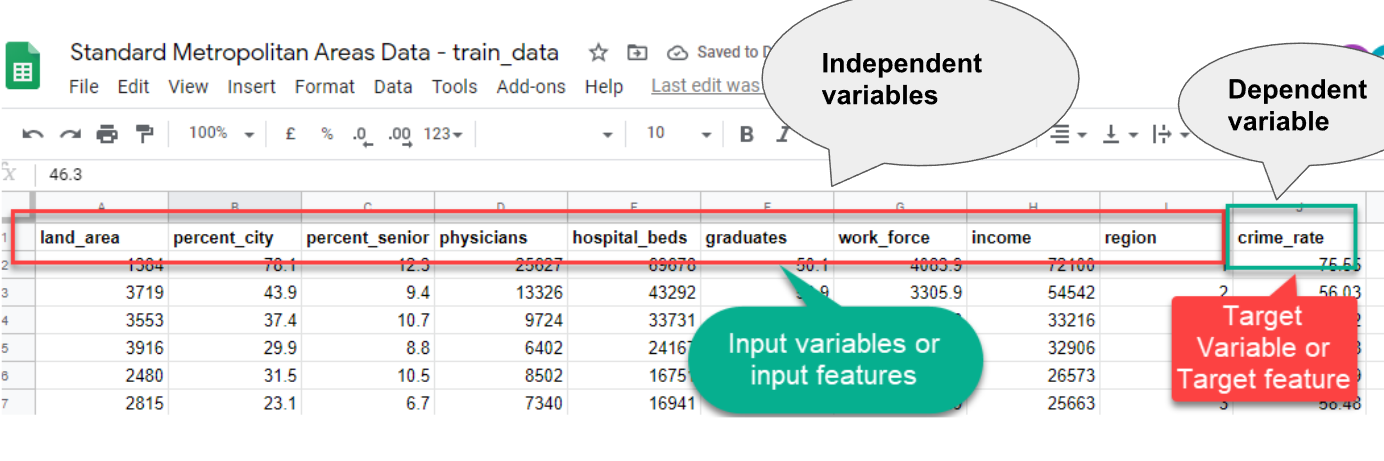
- So far, you've been studying input and output/target variables. Commonly, the input variable is known as the independent variable, and the target variable is known as the dependent variable.
- In a nutshell, our target variable is nothing but a dependent variable. Why dependent? Because the values of this variable are dependent on other variables (i.e., input variables)
- And, our input variables are known as independent variables. Here the values of these variables are not dependent on any other variables.
Let's look at some examples to learn more about them!
- Remember the Standard Metropolitan Areas Data used previously? In that dataset, we might be curious to predict "crime_rate" in future, so that becomes our target variable (dependent variable) and the rest of the variables become input variables (independent variables) for building a machine learning model.
Another Example
- For example, a scientist wants to see if the brightness of light affects a moth being attracted to it.
- The scientist controls the brightness of the light. This would be the independent variable.
- The dependent variable would be how the moth reacts to the different light levels (distance to the light source).
Equation of a Straight Line
- In algebra, a linear equation (equation of a straight line) typically takes the form y = mx + b, where m and b are constants, x is the independent variable, and y is the dependent variable.
- Basically, the value of y is calculated using x, whereas x has no dependence on the value of y.
- y = how far up
x = how far along
m = Slope or Gradient (how steep the line is)
b = value of y when x=0
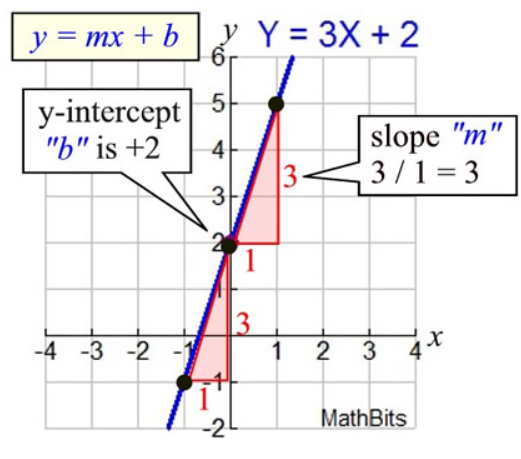
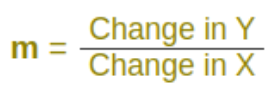
- How do you find "m" and "b"?
- b is easy: see where the line crosses the Y axis.
- m (the Slope) needs some calculation:
Synonyms Recap
Too many synonyms to memorize? Let me put them all down in one place for better understanding:
- Variables = Features
- Input Variables = Attributes = Predictor = Independent Variables
- Target Variables = Labels = Outcomes = Dependent Variables
What is linear regression?
- Suppose you are thinking of selling your home. And various houses around you with different sizes (area in sq. ft) around you have sold for different prices as listed below:
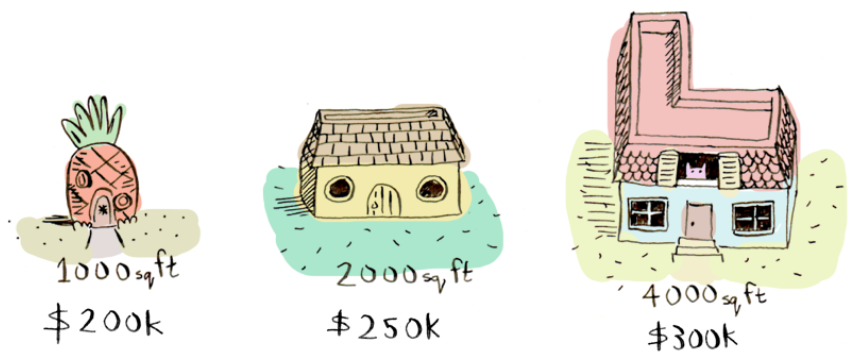
- And considering, your home is 3000 square feet. How much should you sell it for?
- When you look at the existing price patterns (data) and predict a price for your home, that is an example of linear regression.
- Here's an easy way to do it. Plotting the 3 data points (information about previous homes) we have so far:
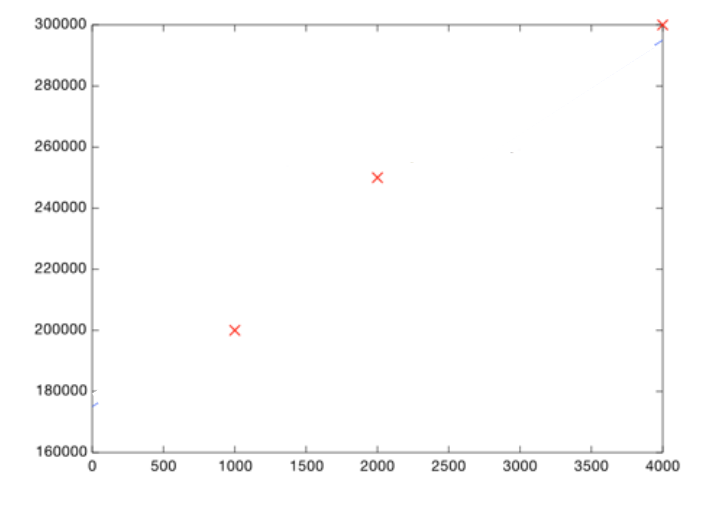
- Now, you can eyeball it and roughly draw a line that gets pretty close to all of these points. Then look at the price shown by the line, where the square footage is 3000:
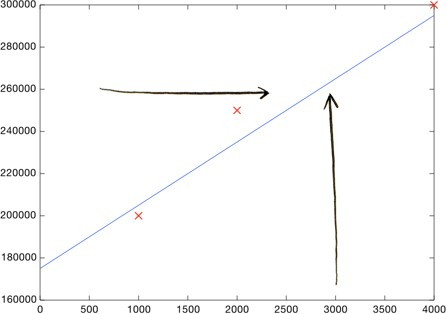
- Boom! Your home should sell for $260,000.
- That's all! (well, kind of) You plot your data, make a rough line, and use the line to make predictions. You need to make sure your line fits the data well (but not too well :)
But, of course, we don't want to make a line roughly. We want to compute the exact line that best "fits" our data. That's where machine learning comes into play!
What is linear regression? - to summarize
- Linear regression is a linear model, i.e., a model that assumes a linear relationship (straight-line relationship) between the input variables (x) and the single output variable (y).
- When there is a single input variable (x), the method is referred to as simple linear regression or just linear regression. Eg: Salary dataset given here. There is only one target variable and one input variable where we are predicting the salary of individual using their years of experience.
- When there are multiple input variables, it is often referred to as multiple linear regression. Eg: Smart Metropolitan areas data set, we have multiple input variables.
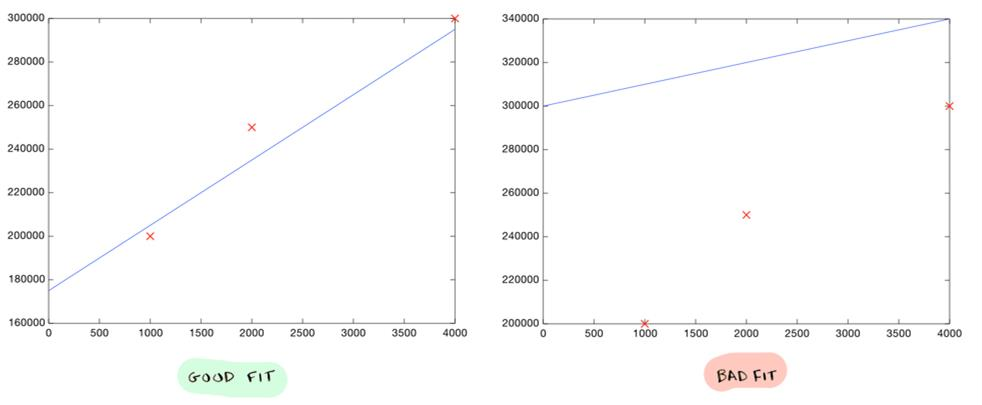
Which line is good?
- How do you decide what line is good? Here's a bad line:
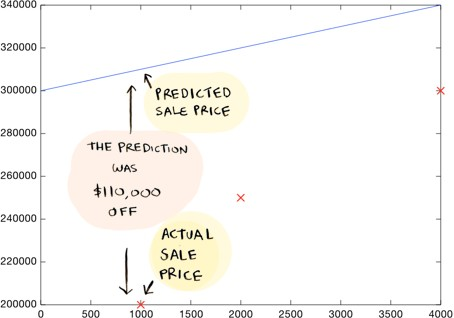
- This above-drawn line is way off. For example, according to the line, a 1000 sq foot house should sell for $310,000, whereas we know it actually sold for $200,000.
Here's a better line:
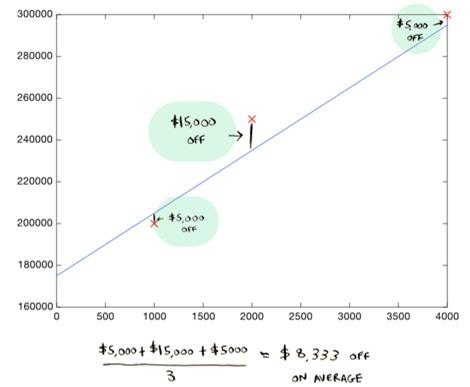
- In this case, the residuals (absolute difference between the actual and the predicted value) are $5000, $15000, and $5000.
- This line is an average of $8,333 dollars off (adding all the distances and dividing by 3).
- This $8,333 is the cost of using this line.
Cost
- The cost is how far off the learned line is from the real data. The best line is the one that is the least off from the actual data.
- To find the best line (to find the values of coefficients), we need to define and use a cost function.
- In ML, cost functions are used to estimate how badly models are performing.
- Put simply, a cost function measures how wrong the model is in estimating the relationship between X and y.
Cost Function
- There is also something called a Cost function that is associated with the analysis. It is slightly mathematical, and we will learn more about it soon!
- Meanwhile, let's run a simple linear regression model. The link to the notebook is given below.