Learning Objectives
-
Distribution
-
Skewness
-
Practise Data Cleaning
Distribution
- Probability - by going with the literal meaning, it is the extent to which something is likely to happen or probable. The same concept applies to statistics when we talk about probability distributions.
- A probability distribution is a function that describes the likelihood of obtaining the possible values (probability) of a variable.
- Suppose a teacher notes down the heights of all students in her class.
- Now, she can draw a probability distribution when she needs to know which outcomes (heights) are most likely, the spread of potential values (range of heights), and the likelihood of different results (probability of each height).
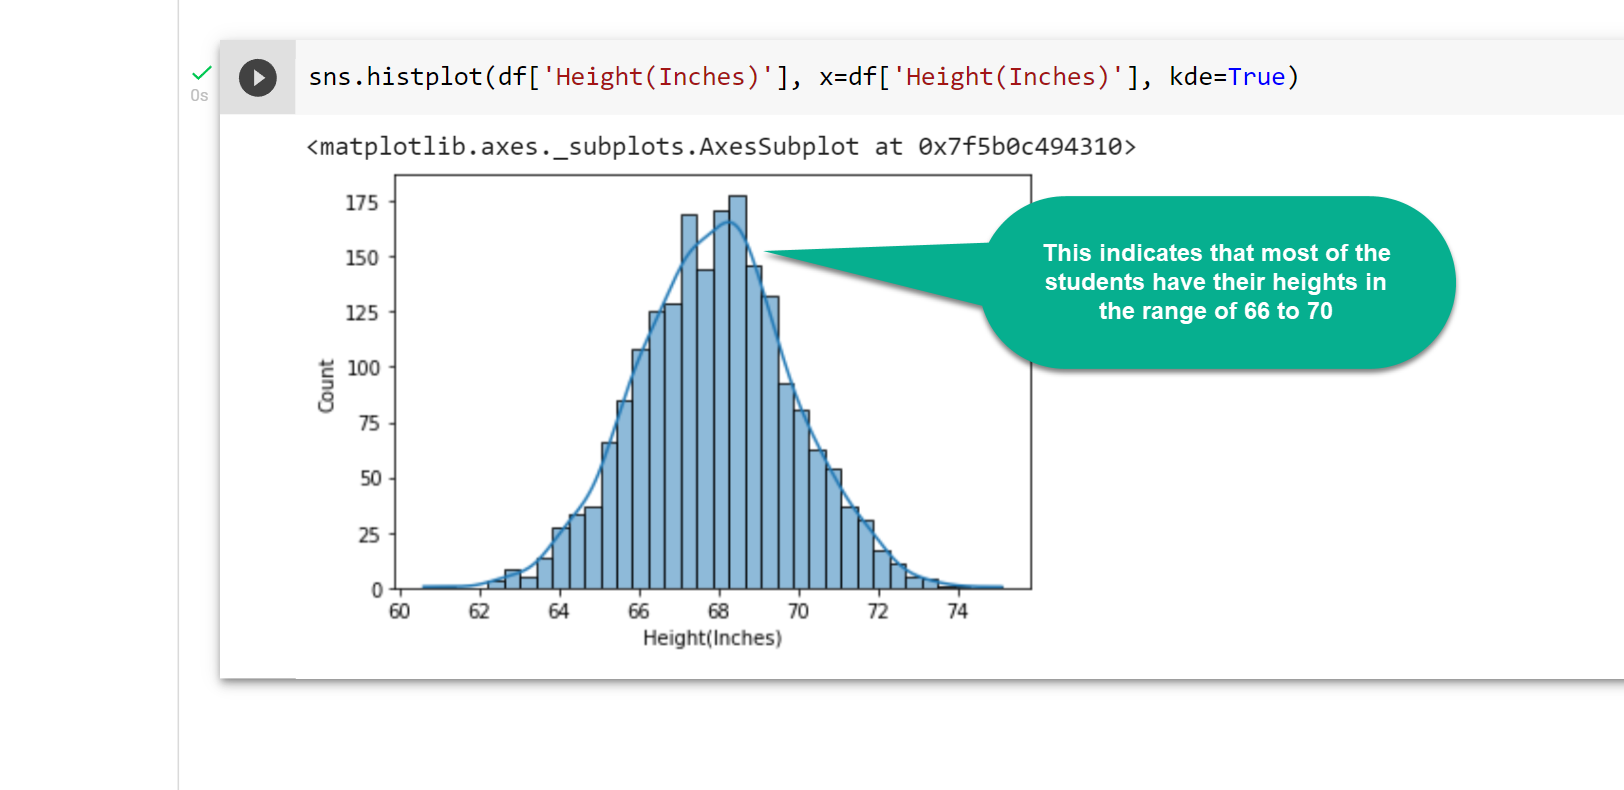
- Let’s take the heights dataset consisting of student IDs and heights: Height Dataset Link
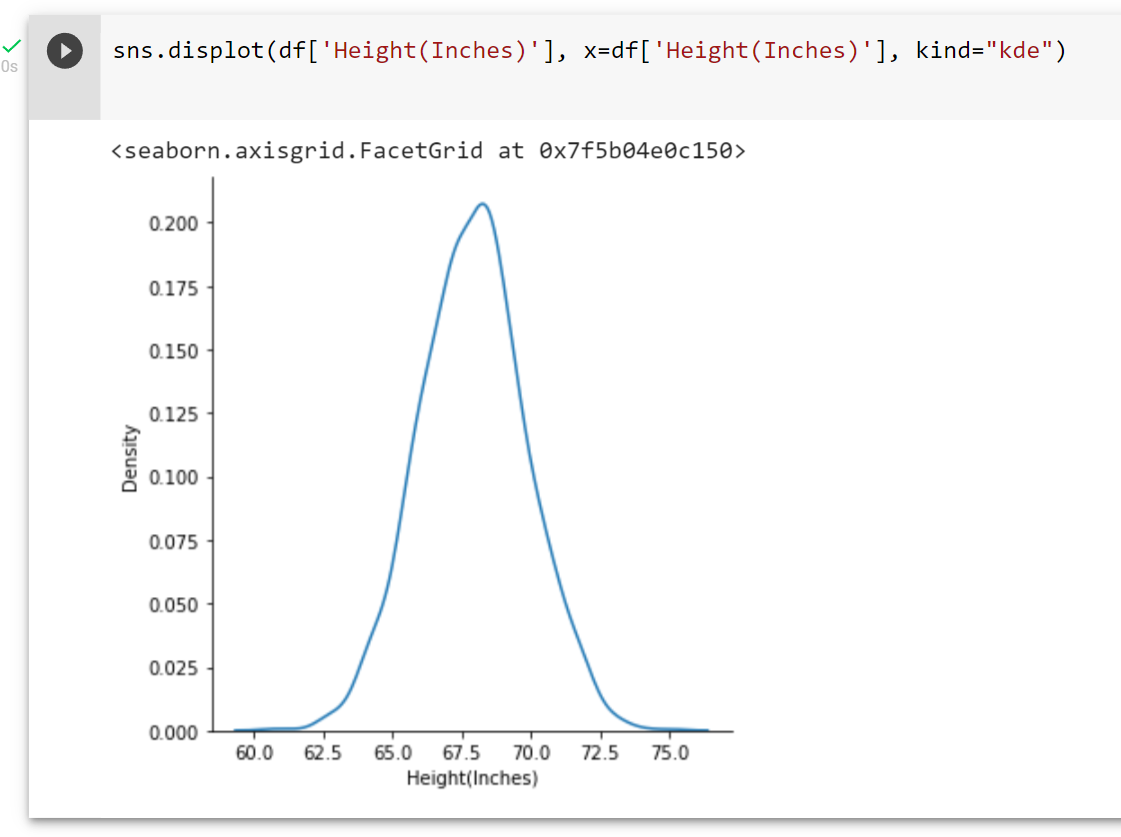
- The most convenient way to take a quick look at a distribution in seaborn is the histplot() and distplot() function. On plotting a distplot on this dataset, we’ll observe a bell-shaped curved like this:
- Probability distributions are usually (but not solely) represented in charts whose abscissa axis ( x-axis) represents the possible values of the variable and whose ordinal axis ( y-axis) represents the probability of occurrence (probability density).
- Most statistical models rely on a normal distribution, a symmetric distribution with a characteristic bell shape.
Normal / Gaussian Distribution
- Also called bell-shaped curve.
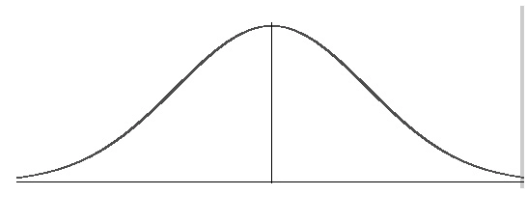
- It is a distribution of data that occurs naturally in many situations.
- It is a probability distribution that is symmetric about the mean, showing that data near the mean are more frequent in occurrence than data far from the mean.
Skewness
- Real-life data rarely, if ever, follow a perfectly normal distribution.
- The skewness measures the symmetry of a distribution or how different a given distribution is from a normal distribution.
- The normal distribution is symmetric and has a skewness of zero.
Types of Skewness
- There are two types of Skewness: Positive and Negative
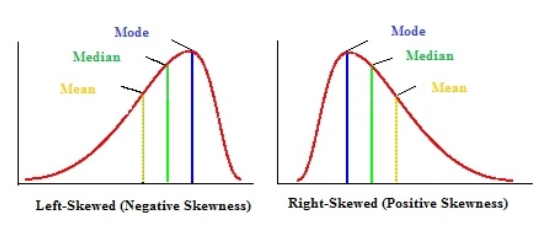
- Positive/Right Skewness means when the tail on the right side of the distribution is longer or fatter. The mean and median will be greater than the mode.
- Negative/Left Skewness is when the tail of the left side of the distribution is longer or fatter than the tail on the right side. The mean and median will be less than the mode.
- For further reading, refer: https://www.statisticshowto.com/probability-and-statistics/skewed-distribution/
Understanding skewness with an example
- Let us take a very common example of house prices. Suppose we have house values ranging from $100k to $1,000,000, with the average being $500,000.
- If the peak of the distribution was left of the average value, portraying a positive skewness in the distribution. It would mean that many houses were being sold for less than the average value, i.e., $500k. This could be for many reasons, but we will not interpret those reasons here.
- If the peak of the distributed data was right of the average value, that would mean a negative skew. This would mean that the houses were being sold for more than the average value.
Data Cleaning Practice
Time to get your hands dirty and clean a dataset!
Follow the various steps of Data Cleaning in this article to clean the Russian Housing Dataset. It covers everything we’ve learned till now.
You’ll analyze and visualize data, detect outliers, remove irrelevant and inconsistent values and get structured, clean data at the end.
https://towardsdatascience.com/data-cleaning-in-python-the-ultimate-guide-2020-c63b88bf0a0d
Slide Download Link
You can download the slides for this topic from here.