Learning Objectives
- Linear Algebra
- Basic Statistics
What is Linear Algebra?
Often the first acquaintance with linear algebra looks something like this:
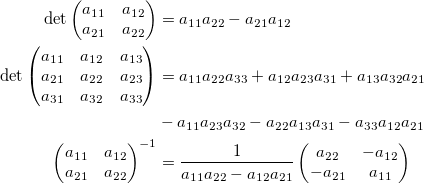
Not very inspiring, right? Two questions immediately arise: where did all this come from, and why is it needed?
Basic definition: Linear algebra is a sub-field of mathematics concerned with vectors, matrices, and linear transforms.
Do You Need Linear Algebra?
- It depends on your goal.
- If you want to use AI and machine learning tools as a black box, you arguably need just enough math to figure out if your problem fits the model's premise.
- But, Linear Algebra is a must-learn if you want to develop new ideas. I don't mean you need to learn everything concerning math. Doing so, you will be stuck at everything and lose motivation towards other more important things like calculus/stats.
- Mathematics in data science and machine learning is not about crunching numbers but about what is happening, why it's happening, and how we can play around with different things to obtain the desired results.
Linear Algebra
- Let's start with a simple problem.
- Condition 1: Imagine the price of two chocolates and one apple is 100 units
- Condition 2: Similarly, imagine the price of one chocolate and two apples is 100 units.
Now, we want to find the price of 1 chocolate and an apple.
- Suppose the price of 1 chocolate is $x and the price of an apple is $y. Values of 'x' and 'y' can be anything depending on the situation, i.e., 'x' and 'y' are variables.
- Translating the above information in mathematical form:
Equation (1)
Equation (2) - To find the prices of chocolate and apple, we need the values of 'x' and 'y' such that it satisfies both the equations.
- The fundamental problem of linear algebra is to find these values of 'x' and 'y' which is nothing but the solution to a set of linear equations.
Graphical Representation of two Equations
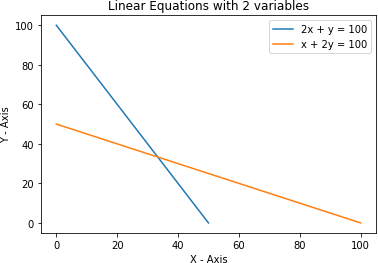
The intersection point is the solution to these two equations.
Complicating the Problem
- In the earlier example, we had two variables, 'x' representing the price of chocolate and 'y' representing the price of an apple.
- Now, suppose you are given a set of three conditions with three variables, say 'x', 'y', and 'z', and asked to find the value of three variables.
- The three conditions are given as:
Equation (1)
Equation (2)
Equation (3) - By solving the above three equations, we can get the values for 'x', 'y', and 'z'.
- In Linear Algebra, data is represented as linear equations. These linear equations are, in turn, described in the form of matrices and vectors.
Matrices
- A matrix is a form of representing data in the form of rows and columns. It is a very natural approach to organizing data.
- A real-life example:
Consider a reactor that needs to be controlled using multiple attributes from various sensors like Pressure (P), Temperature (T), Density (d), etc.

In the matrix above:
- The first column represents Pressure (P)
- The second column represents Temperature (T)
- The third column represents Density (d)
- Each row corresponds to one sample.
Linear Equations in Matrix Form
- Earlier, we had two linear equations:
Equation (1)
Equation (2) - The above two linear equations can be represented in the matrix
form as:

- We can get the above two linear equations from the shown matrix equation by multiplying the two matrices on the left-hand side and equating the corresponding value to the right-hand side.
- Here is an excellent resource on Matrices for further reading: https://www.statisticshowto.com/matrices-and-matrix-algebra/
Additional Resources
- Interested to learn more about linear algebra operations in Machine Learning?
- Check out this helpful resource: https://machinelearningmastery.com/linear-algebra-cheat-sheet-for-machine-learning/
PS: Matrix operations like Addition, Multiplication, and Transposing are commonly used in ML.
Vectors
- Vector is nothing but a one-dimensional matrix.
- For example,
is a vector. This is known as a row vector. Or,
is a column vector.
Derivative As A Concept
Don't worry if you don't know what slope means; it's explained in the video itself:
Derivative As A Slope of Curve
Basic Statistics
What is Statistics?
- Statistics: A branch of mathematics that takes and transforms the data into useful information, which in turn is used to make decisions.
- Statistics is concerned with
- Processing and analyzing data
- Collecting, presenting, and transforming data to assist the decision-maker

What is Data?
Data are facts and statistics collected together for reference or analysis.

Data Types in Statistics
- Categorical
- Nominal: Doesn't have an order. For example, the Gender of a person (male or female)
- Ordinal: Has some order in place. For example, the Grades of students (first division, second division, and third division)
- Numerical
- Discrete: Discrete Data can only take specific values. They are distinct and separate. Example: the number of students in a class. We can't have half a Student!
- Continuous: Continuous Data can take any value (within a range). A person's height: could be any value (within the range of human heights), not just certain fixed heights.
Note: we will get used to these terms soon; no need to worry too much about it. Read this article for additional information: https://builtin.com/data-science/data-types-statistics.

Measures of Central Tendencies
- Mean: The mean is the average of a data set. For example, take a list of numbers:
.
Mean = - Median: The median is the middle of the set of numbers. To find the median, we first sort the list of numbers:
. The exact middle number, i.e., 20, is the median. - Mode: The mode is the most common number in a data set. In the above list of numbers, 10 has occurred twice while the other three numbers occurred once each. So, the mode is 10 here.
Applications of Central Tendencies
- MEAN: When you watch a baseball game and see the player's batting average, that number represents the total number of hits divided by the number of times at bat. In other words, that number is the mean. In school, the final grade you get in a course is usually a mean. This mean represents the total number of points you scored in the class divided by the number of possible points. This is the classic average – evaluating your overall performance with a single number.
- MEDIAN: Although the mean is the most common type of average, the median can also be used to express the average of a group. You may hear about the median salary for a country or city. When the average income for a country is discussed, the median is most often used because it represents the middle of a group. Mean allows very high or very low numbers to sway the outcome, but the median is an excellent measure of the center of the data.
- MODE: Imagine that you live in a small town where most people are employed by a factory and earn minimum wage. One of the factory owners lives in the town, and his salary is in the millions of dollars. If you use a measure like the average to compare wages in the town, the owner's income would severely throw off the numbers. This is where the mode can be helpful in the real world. It tells you what most pieces of data are doing within a set of information.
Measures of Dispersion
- Range: The difference between the highest and lowest values in the data set. For a given list of numbers:
, the range is . - Variance: The average squared differences from the mean.
Steps to calculate variance:- Calculate the mean
- Find the difference between each observation and the mean
- Square all the differences
- Take the average of the squares.
- Standard Deviation: It shows how much your data is spread around the mean. Its symbol is
(the Greek letter sigma). It is the square root of the variance.
Consider the list of numbers:
- The mean of the numbers is
. - Difference of each data point from the mean:
. - Square of all the differences:
- Take the average of the squares: