Learning Objectives
- Input variables
- Target variable
- Train and Test data intuition
- Building an ML Model
In this module, we will give a quick recap that will help you solidify the concepts you have learned so far with some intuitive examples. This will be focused more on Model Building.
Building a ML Model (Quick Recap)
Data Science Modelling Process
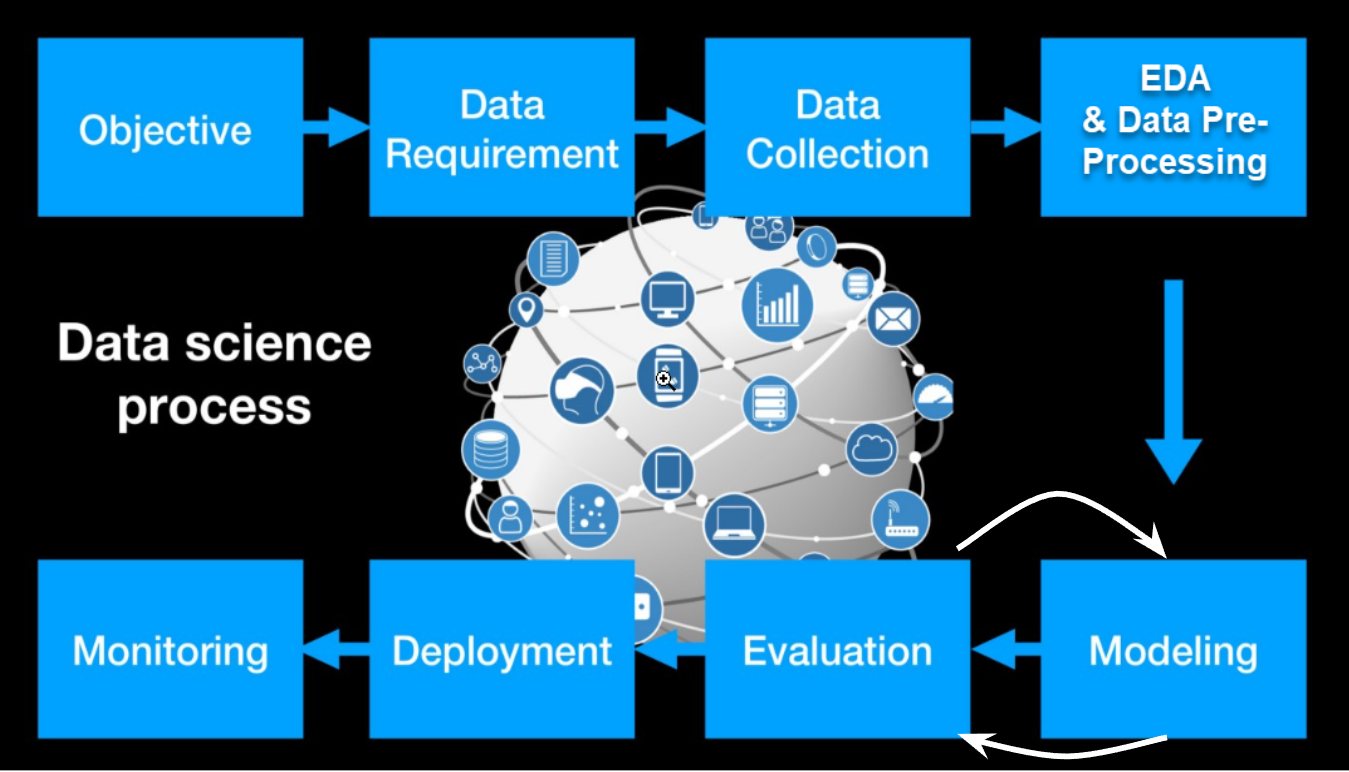
Credits: https://towardsdatascience.com/data-science-modeling-process-fa6e8e45bf02
Problem Solving steps
- Define Objective or understand the problem statement
- Data Requirements
- Data Collection/Preparation
- Exploratory Data Analysis
- Data Pre-processing
- Build a model
- Understand whether it is a regression or classification problem
- Evaluate
- Optimise
- Production
- Monitor
- You keep Optimising it every now and then
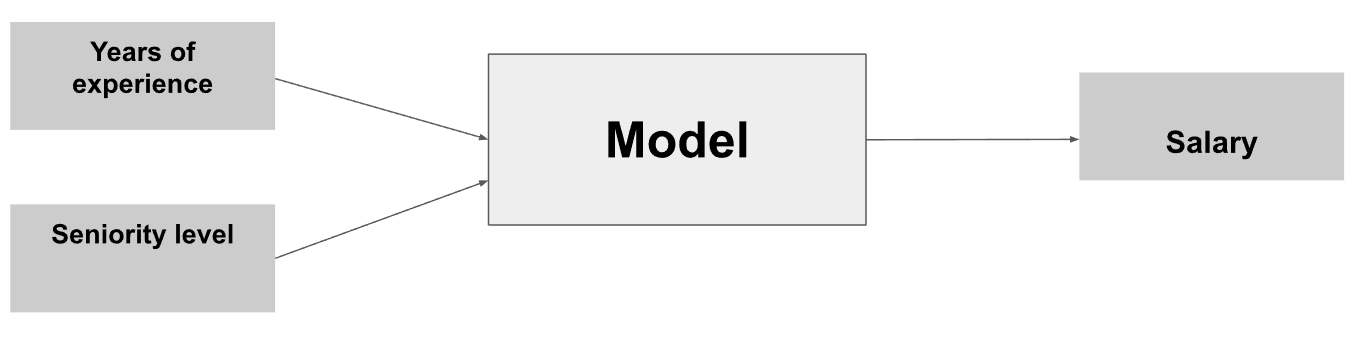
Problem Statement
HR department wanted to seek the support of the analytics team to get possible salary predictions given they have information about employees' Career Seniority Levels and years of experience.
In other words, they need a machine learning model that would predict the possible salary that one should be provided if they feed information about their seniority level and years of experience.
Data Preparation
- Given: we have to predict a person's salary based on years of experience.
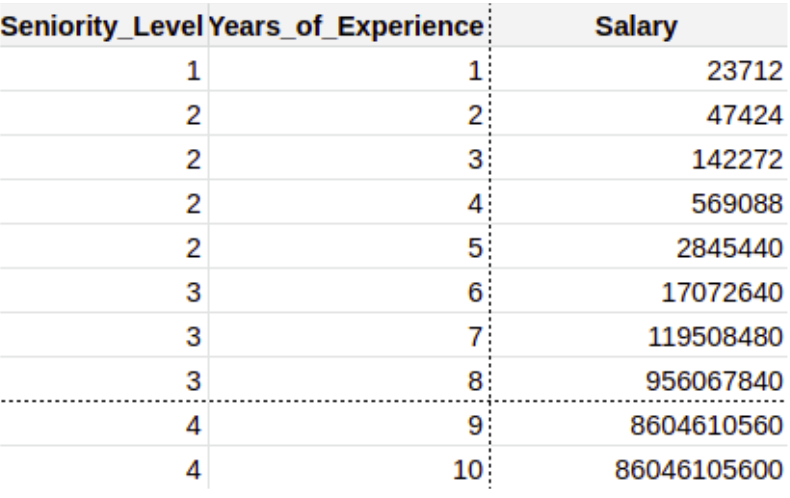
- We have a dataset that looks like this:
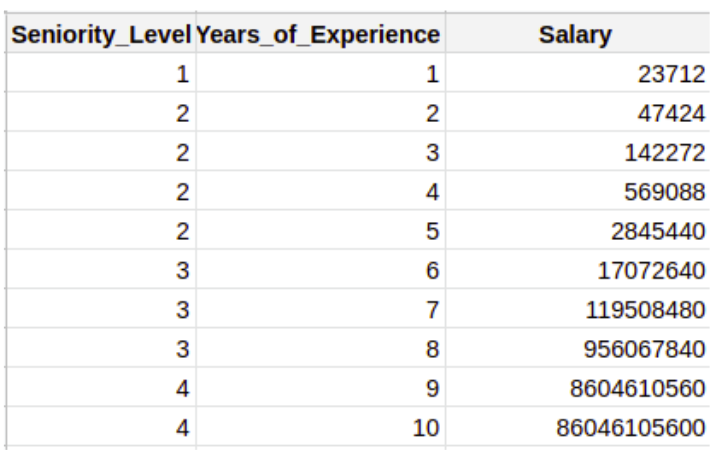
- What features do we have here?
- We have 3 features: Seniority_Level, Years_of_Experience, and Salary.
- What will our target variable(value to be predicted) be in this case?
- Since Salary needs to be predicted, our model will take that to be the target variable and the rest (Seniority_Level, Years_of_Experience) as input variables.
- In short, we’ll predict the target variable using input variables.
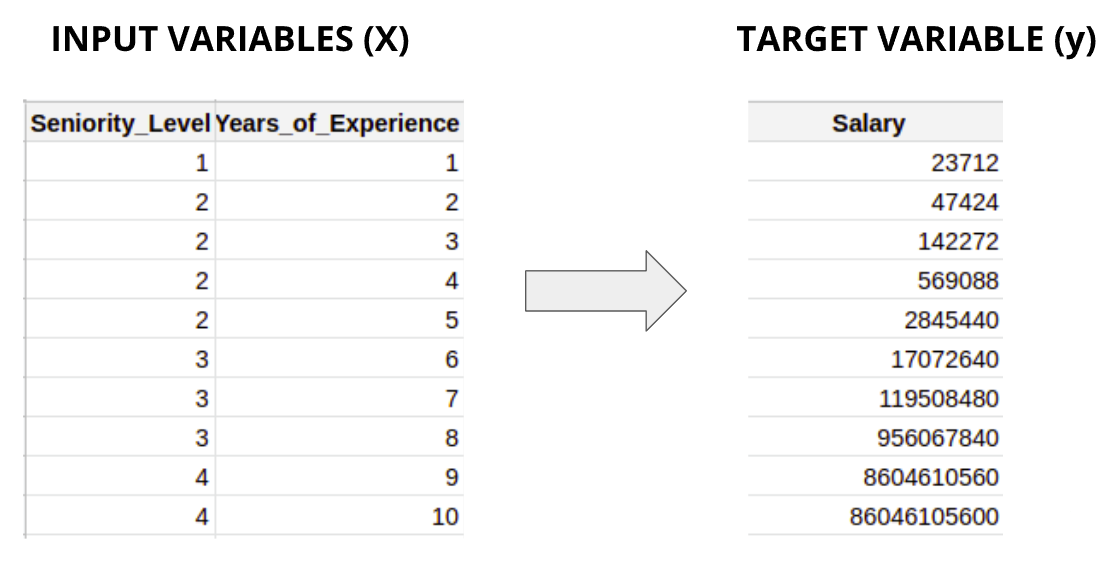
Separating input and target variable
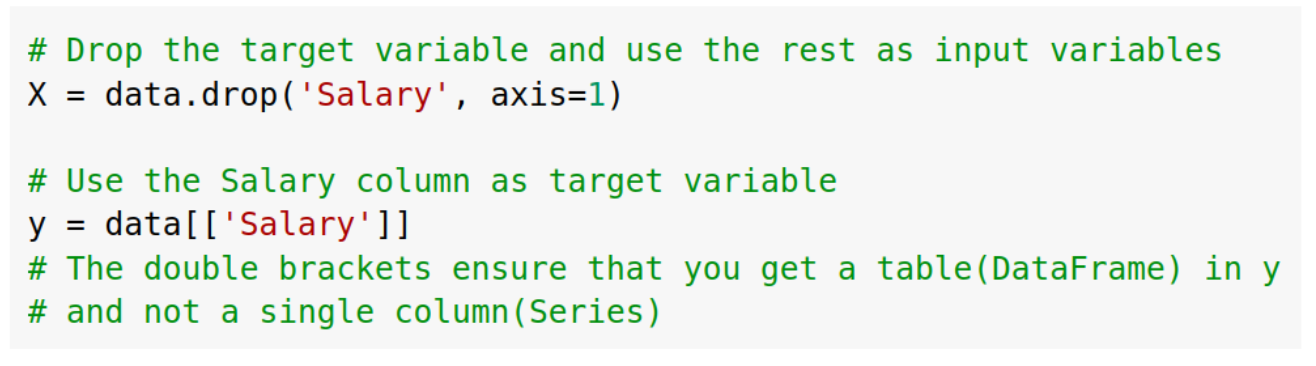
- Now how do you actually separate the input and target variables?
- Since there’s only one target variable in the DataFrame, we can simply drop it and choose the rest of the variables. We do this using the drop( ) function by simply providing column name inside it.
Train and Test Data
- Another data splitting that we need to do is dividing the data into Train and Test Sets.
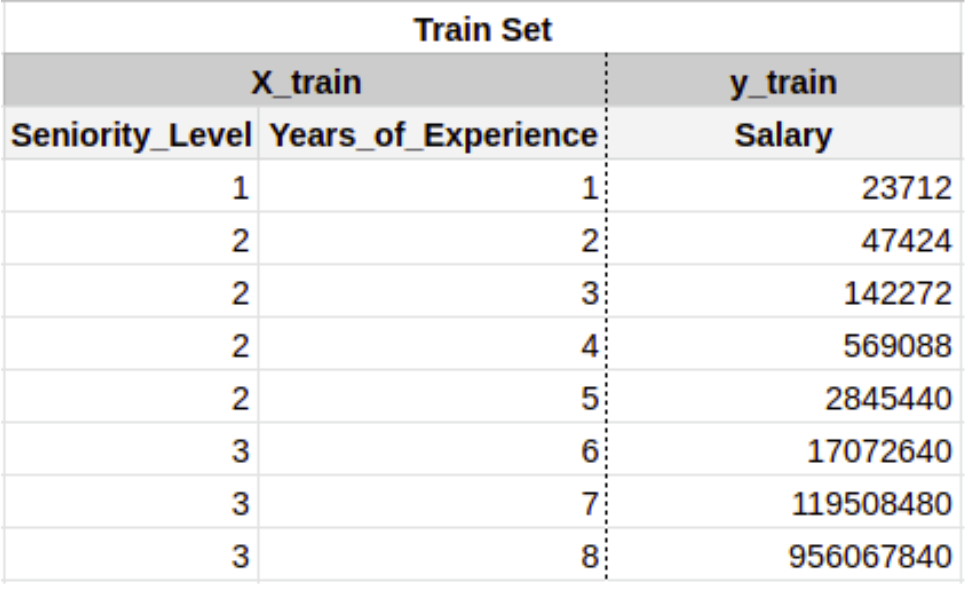
- Imagine drawing a horizontal line between the table, let’s say, after the 8th entry. That’s what Train Test Split looks like. The whole table is now divided into 4 parts.
- PLEASE NOTE: The dataset should always be shuffled before splitting. We’ve used an unshuffled version here just for explanation.
- The upper part of the table becomes the Train Set which consists of X_train (The input variables) and y_train (The output variable).
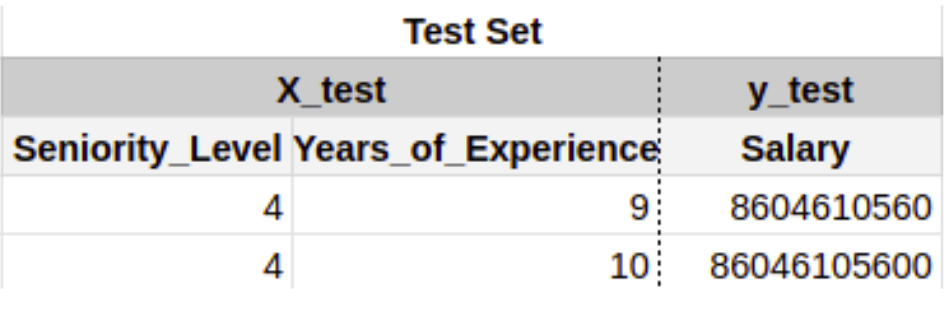
- The lower part of the table becomes the Test Set which consists of X_test (The input variables) and y_test (The output variable).
- The sklearn’s function used for splitting the dataset is known as train_test_split
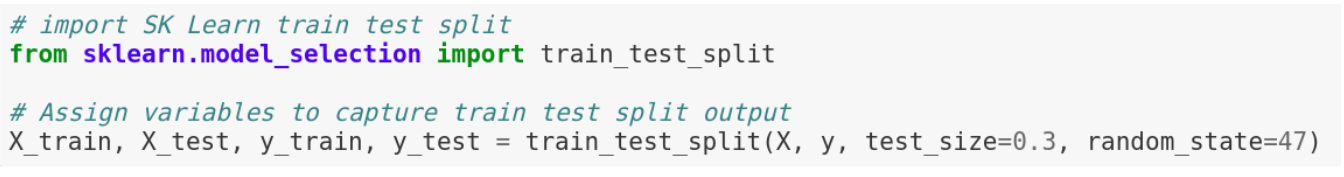
- The 4 variables that we learned about in the previous slides are assigned values using the above piece of code. Let’s understand what the values inside the brackets mean:
- X = Input variables
- y = Target variable
- test_size = The ratio of the dataset that’ll be used in test set. If there are 100 rows, 70 rows will be used in train set and 30 in test set.
- random_state = It is provided just for the sake of obtaining the same result every time we run the code. It ensures that the rows in train and test set remain same each time.
Model Building
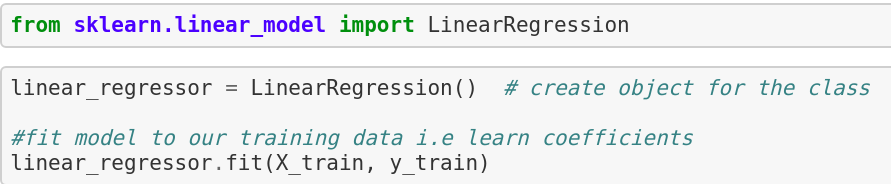
Let’s build the simplest of all regression models using Linear Regression now.
- Import the model from sklearn
- Initialise and store the model in a variable (linear_regressor in this case)
- Train the model on Train Data(X_train and y_train) using the fit method.
Understanding the type of Problem
- For understanding the type of problem, we need to see the target variable we are dealing with.
- What kind of variable is Salary? Does it have classes? No, right?
- Salary is numerical and different salaries are not divided into classes but are rather continuous values.
- The technique used for determining relationship between the input and target variables where the target variable is numerical (or continuous) is known as Regression.
Model Evaluation
- Our model has been created! But how do we know if it works well? By testing it on the Test Data we created.
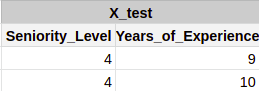
- Remember the test data is also split into 2 parts - X_test and y_test?
- We’ll first put the X_test(input variables) in our model and see what Salary predicts for those input values. The actual values of the salaries(y_test) are not shown to the model.
- Let’s say our model predicts the following salaries:
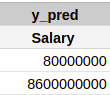
- This prediction is done using the predict function of sklearn. Inside the predict function, we’ll provide X_test to the model.

- To know how good these predictions (y_pred) are, we’ll have to compare them to the actual salary values (y_test).
| ACTUAL VALUES | PREDICTED VALUES |
|---|---|
 |  |
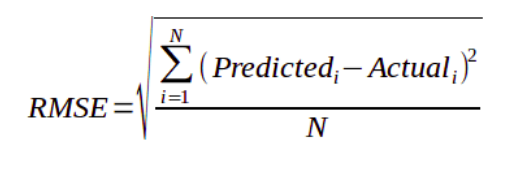
- There are a lot of evaluation metrics for regression problems. Let’s use Root Mean Squared Error for this case.
Root Mean Squared Error (RMSE)
- It is just the square root of the mean square error.
- It is preferred more in some cases because the errors are first squared before averaging which poses a high penalty on large errors. This implies that RMSE is useful when large errors are undesired.
- For using RMSE, we’ll first import metrics library from sklearn.
1 2# import metrics library from sklearn import metrics
- RMSE is not present as a function in sklearn. So we’ll just use the mean_squared_error function and take its square root . The main thing to note is what we provide inside the function - y_test (actual value) and y_pred(predictions made by our model).
1 2# print results of RMSE print(np.sqrt(metrics.mean_squared_error(y_test, y_pred)))
Video Tutorial
Transformations on Train and Test
- Now let’s say we performed some feature selection techniques and found out that Seniority_Level is not an important feature, the model can perform better when only Years_of_Experience is used.
- We’ll then transform our train data to a dataset with only Years_of_Experience as input variable to predict our target variable Salary.
- Now what about test data? Should we remove the Seniority_Level feature from that as well?
- The answer is yes.
- The Train and Test data must undergo the same data preparation steps. Otherwise, the predictive model will not make sense. This means that the number of features for both the training and test set should be the same and represent the same thing.
- Similarly, if normalization is required, then it should be done on both the train and test sets.
Slides Download Link
You can download the slides for this topic from here.